

After a brief diversion in terms of our blog’s subject matter, today we return to Jiaqi Sun’s review of enterprise risk assessment methodologies, continuing with the section of risk and its impact.
Read Impact of Risk by clicking here
- The peaks-over-threshold method (Oesterreichische Nationalbank, 2006)
Moderately extreme observations within a sample can be used to infer the properties of the extreme areas of a distribution not covered by the sample. This estimation technique makes it possible to model the distribution of extreme events above a predefined high threshold. The excess values are modelled using generalised Pareto distributions, while the frequency of the excess values is represented by Poisson distributions.
- Fuzzy logic, Bayesian belief networks, neuron networks, bootstrapping (Oesterreichische Nationalbank, 2006)
Fuzzy logic methods allow a mathematical description of fuzzy data and the integration of qualitative and quantitative data. It can quantify risk based on non-numeric, subjective evaluations and expert knowledge in, for example, self-assessments. Fuzzy logic is especially suited for complex multi-factorial systems.
Bayesian belief networks are another technique for integrating subjective beliefs and insecure knowledge into the quantitative modelling of operational risks. The advantage is it supports scenario analyses using cause-and-effect relationships. The subjective evaluations by experts are essential for the future-oriented analyses.
A concept related to fuzzy logic is artificial neural networks. Their essential characteristic is the ability to learn by adapting weights in the neural model. They are primarily suitable for solving classification and forecasting problems. Banks have used neural networks for credit rating. Bootstrapping is a statistical resampling technique used to improve estimation when there is a small data set. The repeated modification of the data allows the evaluation of the statistical error of a hypothesis. Compared to the Monte-Carlo simulation, the simulated data sets are generated from the original data set.
- Loss distribution approach (Oesterreichische Nationalbank, 2006)
The loss distribution approach is based on the assumption of the shapes of statistical distribution for operational loss events. The categorised and adjusted data sets are first used to model the loss severity and frequency distribution for each business unit or incident type and then summarised in an overall loss distribution using Monte-Carlo simulation or other statistical methods such as Panjer’s algorithm. This overall loss distribution is the basis for determining the required capital charge. As there is no single and clear way to evaluate risk throughout an enterprise, risks are categorised by the type of risk events and business units in which they occurred (Lopez, 2002).
- Relative ranking/Risk indexing
This is a method to break down a specific risk per some form of operating asset, for example, the spill risk per type of ship as illustrated in the bar chart below.
Spill risk for generic ship types
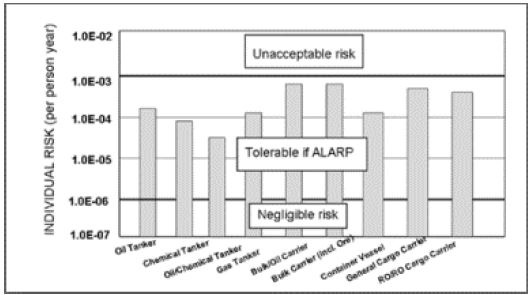
Source: Gasparotti & Rusu, 2012)
Risk profile per type of risk
Source: Australian Government, 2016
Risk reporting using nomograms
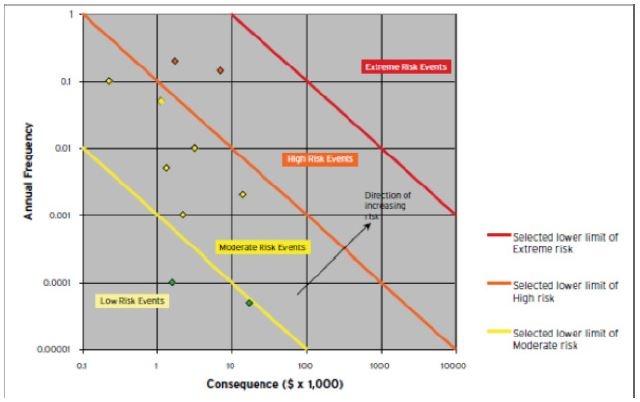
Source: Australian Government, 2016
- Business process analysis (Oesterreichische Nationalbank, 2006)
In operational risk management, business process analysis is used to link processes, risks and controls in a risk analysis. It ensures risk-oriented process optimisation. The identification of business processes across all organisational units is a prerequisite for allocating loss data to processes and determining the risk for a business process. A rough business process analysis should be carried out before self-assessment. Processes are assigned to products and process chains are examined for risk-sensitive items of different loss scenarios.
- Scenario analysis (Oesterreichische Nationalbank, 2006)
Identifies possible high-severity events that might occur in the future. Scenarios are set based on expert knowledge. There is a close link between scenario analyses and stress tests because of the prerequisite of identifying extreme scenarios. These tests are used to simulate and weigh the severity of different scenarios. As illustrated in the chart below, the scenario funnel illustrates the spread of scenarios and the spectrum of conceivable future situations, which widens due to the influence of incidents and interventions over time.
Scenario tunnel
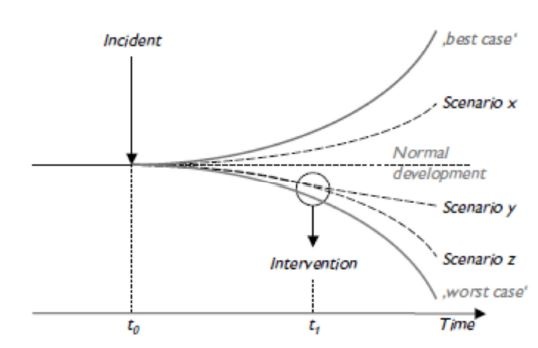
Source: Oesterreichische Nationalbank, 2006
- Key risk indicators (KRIs) (Oesterreichische Nationalbank, 2006)
KRIs provide information on the risk of potential future losses, which permits trend analysis and can serve as early warning indicators, for example, in combination with a traffic-light system (red, yellow, and green). Frequency is determined by the response time and the expected loss severity.
Examples of KRIs are:
- Staff fluctuation rate
- Days of sick leave
- Hours of overtime
- Number and duration of system failures
- Internal audit findings
- Frequency of complaints
- Wrong account entries
In addition to risk indicators, the following related indicators are sometimes mentioned:
- Key control indicators
- Key performance indicators
- Key management indicators
It is difficult to classify and compare KRIs within the organisation, or with industry peers. Large enterprises may have many indicators, which makes it difficult to aggregate the information.
- MIL-STD-882 (Mirzai & Makarov, 2005)
Has been incorporated into system safety standards used in, for example, the chemical processing and medical device industries. The semi-conductor manufacturing and nuclear power industries use many system safety analytical techniques during the design of production processes, equipment and facilities, due to the enormous cost of incidents in production capability, product quality and human life.
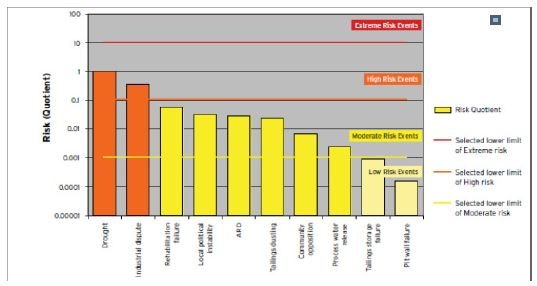
- Consequence table (semi-quantitative)
Risk evaluation is a complex area, in which the risk level is compared to predetermined acceptance criteria to facilitate decisions on risk control. In the mining industry, due to the fluid and changing nature of the mining process, risk analysis produces a comparison of risks rather than an absolute assessment. A consequence table (as illustrated below) is one tool that is commonly used in the mining risk assessment, which does not aim for perfection but allows for useful comparisons between diverse types of events (Australian Government, 2016).
Consequence table
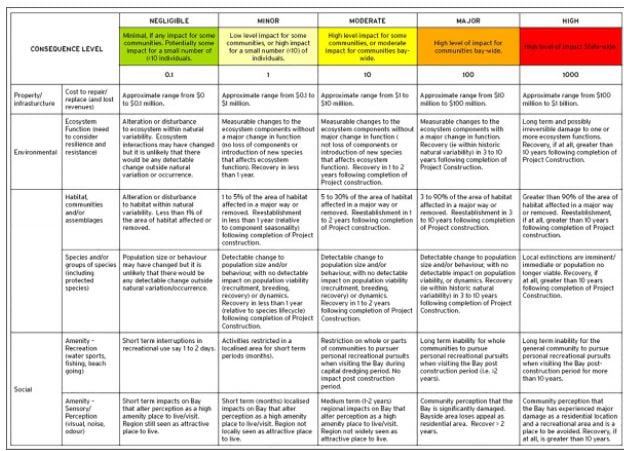

Source: Australian Government, 2016
- Tornado diagram
A quantitative risk analysis and modelling technique used to determine which risks have the most potential impact on a project, according to the Project Management Institute (2013). As illustrated below, a tornado diagram is used to compare the risks within a project.
Tornado diagram
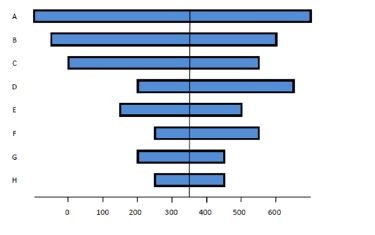
Source: Pennsylvania office of administration for information technology
The diagram allows the project manager to visualise different aspects of risk and compare them against the same aspect for other risks. It also allows managers to quickly prioritise risks for the project, based on, for example, the cost of a risk and risk score.
- Decision tree analysis
A diagramming and calculation technique for evaluating the implications of a chain of multiple options in the presence of uncertainty, according to the Project Management Institute (2013). As illustrated in the diagram below, the options are presented as branches of the tree. A cost or revenue value is assigned to each possible decision, which combines with an event probability assigned to each decision to generate the outcome value for each possible decision as follows:
- Outcome Value (Decision 1) = (Revenue – Cost) x Event1 Probability
- Outcome Value (Decision 1) = (Revenue – Cost) x Event2 Probability
- Outcome Value (Decision 2) = (Revenue – Cost) x Event3 Probability
- Outcome Value (Decision 2) = (Revenue – Cost) x Event4 Probability
The decision that yields the greater outcome value should be chosen.
Decision tree
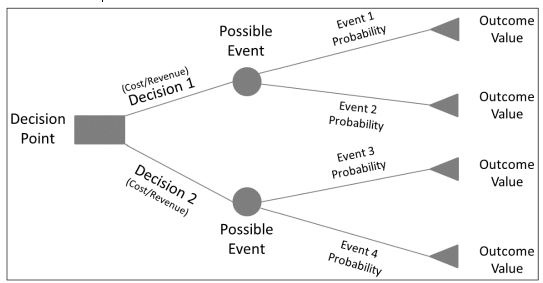
Source: Pennsylvania office of administration for information technology
- Modelling and simulation (Pennsylvania office of administration for information technology)
Uses a model that transforms the specified uncertainties of a project into their potential impact on project objectives. Monte-Carlo simulation uses an iterative process to evaluate cost or schedule data by running the model a specified number of times to achieve a statistically valid sample size. The simulation uses the ‘Optimistic’, ‘Most Likely’ and ‘Pessimistic’ estimates associated with the three-point estimating technique to calculate the number of times a particular outcome was reached and associated confidence levels.
- Crime risk assessment mechanism (European Commission, 2006)
It follows a similar method to the ISO 31000 risk assessment process and is an application of the frequency and severity methodology through unpacking probability into legislative cause and market vulnerability. The mechanism consists of four main steps to assess the criminal implications contained in a legislative/regulative text.
Step 1 initial screening
Step 2 preliminary crime risk assessment
Step 3 extended crime risk assessment: an analytical/quantitative activity, which aims to quantify the risk in step 2, by calculating a legislative crime threat (LCT) and legislative crime risk (LCR) index. The latter is a numerical vector function of threat (the likelihood that a crime occurs because of legislation) and its seriousness (the harm caused by a given crime on the society).
- LCTc = α*TD + β*MVc
TD is textual deficiencies index, i.e. legislative faults, MV is market vulnerability index, c is a given single crime. α + β =1
- LCRc = [LCTc; Sc]
S is seriousness index
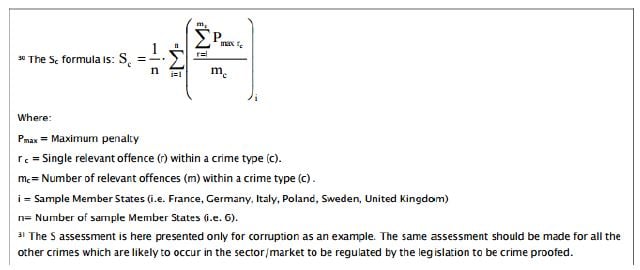
Source: European Commission, 2006
These indices can be further unpacked into contribution factors; these indicators can be addressed through questionnaires. The indices are calculated through dividing the number of “Yes” answers by the result of total number of questions minus the number of “Not Applicable” answers.
Step 4 Conclusions and recommendations
- Accident prediction model (APM)6 (Kim & Sul, 2009)
The generalised linear regression model relates accident frequency by category to the functions of traffic and pedestrian flow, and a range of other junction variables. The typical form of a generalised linear model is as follows:
log A = logb0 Xb1 Xb2 = logb0 + b1 log X1 + b2 log X 2
A is the annual mean number of accidents, Xn is the average daily flow of vehicles, bn is the model coefficients. To improve the accident forecasts of old prediction models, one can increase the level of geometric data, including junction curvature, sighting distance, and entry width.
The advantage of APM is that it can be readily applied to four-arm and three-arm intersections in urban areas with minimal data. The main weakness is that the model is not transferable to other countries, as road users' behaviour varies by areas.
- The Surrogate Safety Assessment Model (SSAM) for traffic facilities (Kim & Sul, 2009)
SSAM is a technique that combines micro-simulation and automated conflict analysis and analyses the frequency and character of narrowly averted vehicle-to-vehicle collisions in traffic, to assess the safety of traffic facilities without waiting for a statistically above-normal number of crashes and injuries to actually occur. Research is ongoing in this area. While simulation models and video technology improve, the use of this technique is expected to grow.
- Human health risk assessment (including ergonomics)
The method is in line with frequency, severity and exposure risk assessment methodology by breaking down the severity into two components: does-response and exposure.
Health risk assessment characterises the potential adverse health effects from human exposures to environmental hazards, such as toxic substances. It is also used to identify vulnerable populations such as infants, children, and the elderly who may be at increased risk from exposure to environmental health hazards, and to identify the hazards that pose the greatest risks to public health.

