- Risk impact and likelihood matrices (qualitative or semi-quantitative):
This is a statistical approach based on the distribution generated by the frequency and severity matrices.
By comparing the distribution curve generated by a mathematical model and the actual curve of the real data, the model is reliable if both curves overlap completely, or to a large extent.
By using Monte Carlo simulation to combine the two curves, it can generate an aggregated distribution per business unit and type of risk event. The VaR method is used to calculate the maximum loss amount at 99.9% confidence level. The disadvantage of the statistical approach is that operational incidents are treated as completely uncorrelated and does not take into account possible cumulative effects.
Statistical approaches can be biased, as they sometimes build calculations on a few, scattered sample data and a number of subjective assumptions. These methods rely on historical data, hence they have less predictability on the future risk profile of the enterprise, such as the low-frequency-high-severity incidents. According to Fimarkets, these incidents result from internal changes (e.g. new organisations and activities) or external changes (in markets, competitors, and the emergence of new fraud techniques).
- Scorecards
Based on the frequency and severity approach, scorecards have the advantage of using risk indicators to predict future risk events as opposed to historical data on which statistical analysis is based. Scorecards build an assessment grid for each category of risk and each business unit. The risk indicators include quantitative and qualitative factors, for example, sales turnover and speed of change. Questionnaires are used to provide input for risk indicators, which are used to analyse the frequency and severity of an incident and generate a score for each business unit under each risk category.
Typically in the financial service industry, a capital reserve is allocated proportionately according to the score (according to Fimarkets).
- Business process mapping
Business process mapping is a common technique used to assess and manage operational risk throughout an enterprise. It consists of identification of process steps, assessment of inherent risks, risk interrelationships, the effectiveness of risk control measures, and taking corrective and preventative actions to improve control effectiveness (The Canadian OFSI, 2016).
- Comparative analysis
Comparative analysis includes functions performed by the first line of defence in corporate governance: business unit management and internal controls. It reviews the risk assessments and outputs of each risk management tool to confirm the overall assessment of operational risk. Comparative analysis enables consistent risk assessments and facilitates the sharing of lessons learned in the organisation. Comparative analysis can also help assess the consistency and effectiveness of risk management tools through supporting consistent information gathering, aggregation and analysis (The Canadian OFSI, 2016).
- Strategic map and risk event card
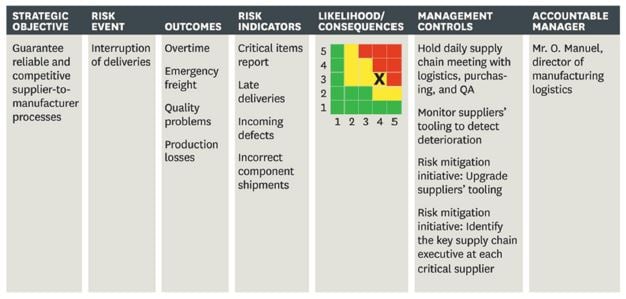
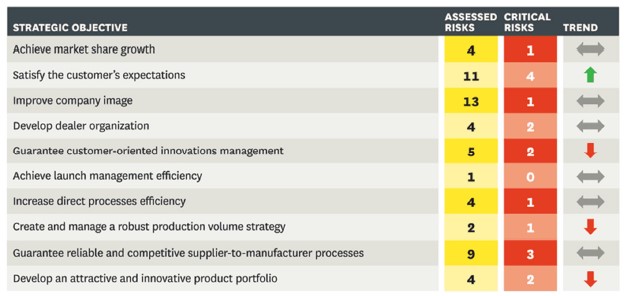
Automotive manufacturer VW uses strategic map as a starting point for its risk dialogue. On the map, VW identifies risk events that hamper the company from achieving its objectives. Then the risk management unit generates a risk event card for each risk on the map, which lists the effects on operations, the probability of occurrence, leading indicators, and potential actions for mitigation. As illustrated in the table below, the risk matrix is part of the risk event card and persons responsible for each risk event is assigned (Kaplan & Mikes, 2012).
Risk event card

Risk report card

- VaR (a form of quantitative scenario analysis) (Oesterreichische Nationalbank, 2006):
As there are more than one ways to quantify different types of risk, enterprises are expected to find a mix of methods that correspond to the risk profile of, for example, business units.
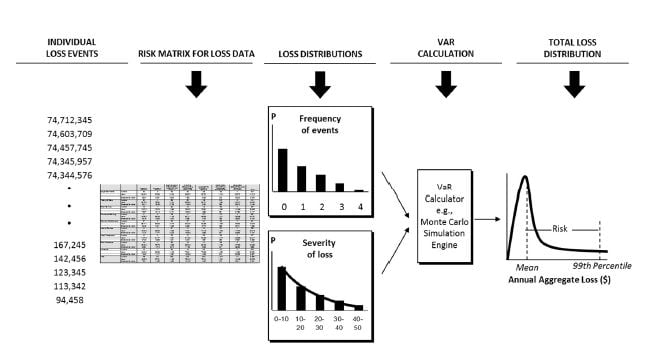
VaR is a technique commonly used in the financial services industry to estimate the maximal monetary loss at a certain probability (confidence level) over a predefined period of time. This is due to its focus on the high-frequency-high-severity incidents, as these incidents are in need of effective control measures. The chart below demonstrates the key steps in calculating VaR with the Monte Carlo simulation for generating the large amount of data required for the calculation.
VaR risk assessment process

Source: Samad-Khan, 2005
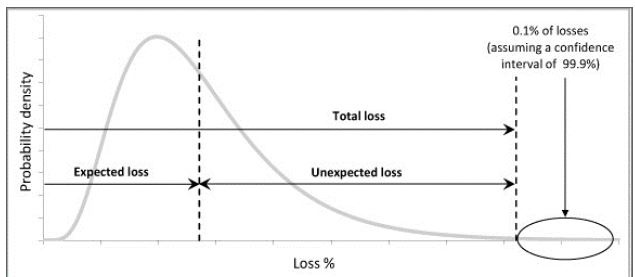
Hypothetical loss distribution of the VaR method with expected and unexpected losses at the 99.9th percentile confidence level

Note: the 0.1% of losses is not accounted for, as those losses are outside of the confidence interval for risk or loss estimation, as they are the Type I statistical error or false negatives. Expected loss is high-frequency-low-impact incidents, where the majority of incidents are located. The unexpected loss is the low-frequency-high-impact incidents which are more towards the right tail of the curve and require capital reserve to guard against.
Source: De JonghI et al., 2013
The main concern with VaR is the maximal loss amount is very sensitive to the data and models used. There are some research that have focused on improving the accuracy of VaR such as Dahen and Dionne (2010) who proposed scaling methods applied to both frequency and severity loss data, using credibility theory. Agostini, Talamo & Vecchione (2011) proposed an integration model that allows integrated parameter estimation through the use of historical loss events and expert opinion. The parameter integration is a compounded average of historical data and subjective parameter estimates whose weights reflects the credibility assigned to each source (De JonghI, De JonghI, De JonghI & Van Vuuren, 2013).
A shortcoming of VaR is the uncertainty about the extent to which a loss exceeding VaR can differ from VaR. In other words, how bad is bad. Alternative risk measures taking account of the tail part of the distribution curve include conditional VaR, tail VaR and expected shortfall, which are better suited to the specific distribution of risks. Some popular techniques that focus on the tail of the distribution curves include the Burr distribution and the generalised Pareto distribution.


