

Today’s blog offers an extensive understanding of risk analysis and evaluation. It’s a biggie, but we assure you all the information is critical to grasping the full scope of this aspect of risk management.
The objective of risk analysis is to support the evaluation of the nature and distribution of risk, and the development of appropriate strategies to manage the risk. The chart below illustrates typical risk events with different frequency and severity levels.
Examples of risks of different frequency and severity
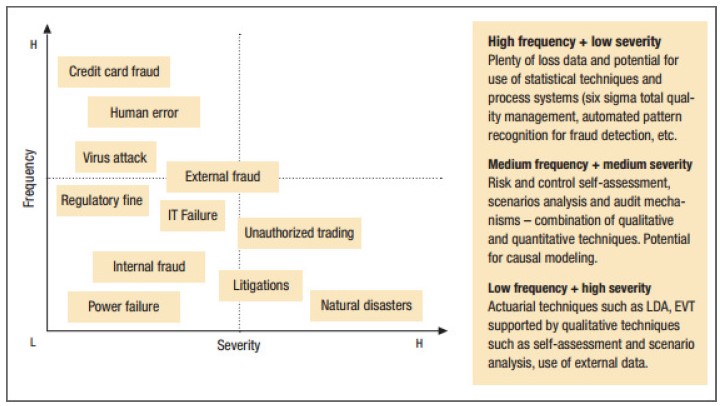
Source: Mirzai & Makarov, 2005.
When some risks are known well and understood, and specific, mandated controls are in place, your risk analysis may proceed directly to risk treatment to evaluate the effectiveness of controls (Safe Work Australia, 2012). Qualitative methods are the most commonly applied, as they are relatively easy to use. Qualitative methods use descriptive terms to identify and record the severity and frequency of risk. Quantitative methods identify likelihoods as frequencies or probabilities and identify severity in terms of relative scale (orders of magnitude) or specific values (for example, estimates of cost, and number of fatalities). Monte Carlo simulation methods may be used to refine uncertainty in the estimates of frequency and severity into quantitative estimates. All risk analyses are based on assumptions that a certain event will (or will not) occur at a certain place and time, and under assumed circumstances. If those assumptions are incorrect, the risk assessment is flawed. Therefore you should validate the assumptions, especially those for the estimates of frequency for rare events, as much as possible and consider the widest range of risk scenarios (Australian Government, 2016). Most severity modelling today makes use of computerised analytical models (American Bureau of Shipping, 2000).
Risk evaluation or characterisation generates a risk value or rating for comparison and prioritisation based on criteria such as:
- project lifecycle stages
- sites
- companies
- industries, or
(Basel Committee on Banking Supervision, 2011).
The following are the primary risk analysis and evaluation techniques currently in use by various industries:
- Subjective prioritisation: A simple qualitative form of risk analysis, which helps identify potential risk scenarios using structured hazard identification techniques, such as HAZOP and FMEA. Each scenario is assigned a priority category based on the perceived level of risk. Priority categories can be: 1) low, medium, high; 2) numerical assignments; 3) priority levels.
- Risk matrices/categorisation (semi-quantitative or qualitative; a form of scenario analysis): The matrix approach can be based on qualitative scenario analysis, semi-quantitative frequency and severity assessment, or more sophisticated statistical and mathematical modelling approaches, such as simulation for analysing low-frequency, high-impact incidents. The matrix or frequency-and-severity methodology is the foundation of all other risk methodologies and techniques. The output is frequency-weighted severity and risk is eventually linked to some value of loss. In the insurance sector, some sophisticated algorithms are used for the assessment of frequency and severity (see an example on Courtney method in Rot, 2008). The following is an illustration of the matrix methodology in a qualitative approach, as the value of impact and likelihood are predefined as opposed to actual measurement value of each risk.
Risk matrices by risk management industry (left) and COSO (right)
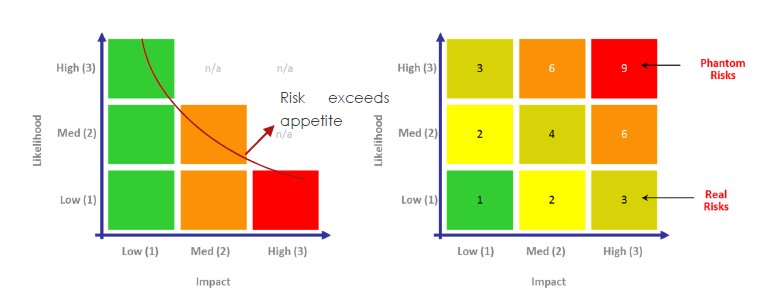
Source: Risk management industry, COSO
Risk matrices are forms of scenario analyses that assign probabilities to different levels of severity. As shown in the charts above, COSO believes the high-risk area (phantom risks) is at the top right corner of the matrix, whereas the risk management industry believes the high risk area (real risks) is situated at the bottom right corner, as the phantom risk events are unmanageable. Visually the matrix reveals a two-dimensional probability density function curve.
For operational activities in manufacturing, transaction processing and other activities involving a large volume of identical trials with small variations in loss amount, losses follow a Poisson frequency distribution and are characterised by a normal (or some other symmetrical) severity distribution. For most other risk management applications, event frequencies are not well-behaved and severity distributions are often positively skewed. Under these conditions, frequency multiplying severity is of little value (OpRisk Advisory and Towers Perrin, 2010).
Risk control measures that reduce frequency are preferred to consequence-reducing measures. For example, it is better to prevent a fire from starting than to mitigate the consequences of the fire after the conflagration (De JonghI, De JonghI, De JonghI & Van Vuuren, 2013).
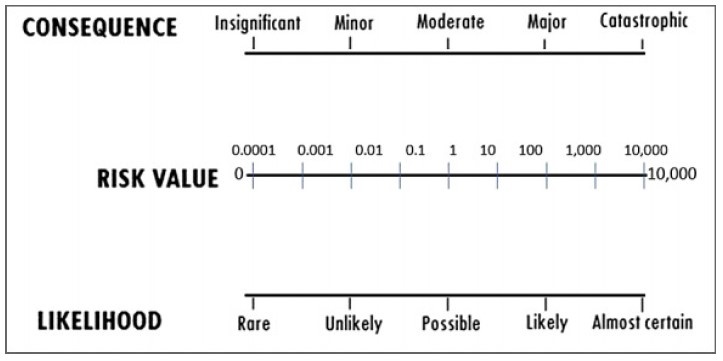
An advantage of the matrix approach is that it allows risk ratings to be set based on the derived numerical risk values. A major shortcoming is that those values might not reasonably reflect the relative risk of events due to possible order-of-magnitude differences within the frequency and severity classes. To overcome this drawback, their relative scales are differentiated as shown in the matrix below. While matrix-based semi-quantitative risk assessment methods are easy to use, they will not generate more accurate assessments or provide a cost-benefit base for control options (Australian Government, 2016).
A basic semi-quantitative risk rating matrix with logarithmic scale
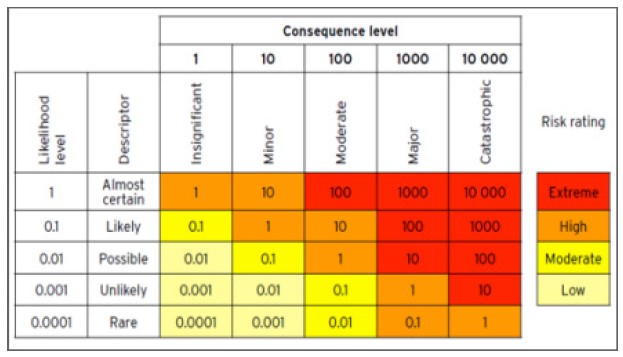
Source: Australian Government, 2016
Risk appetite matrix for risk averse organisations in manufacturing industry
Source: Bustad & Bayer, 2012
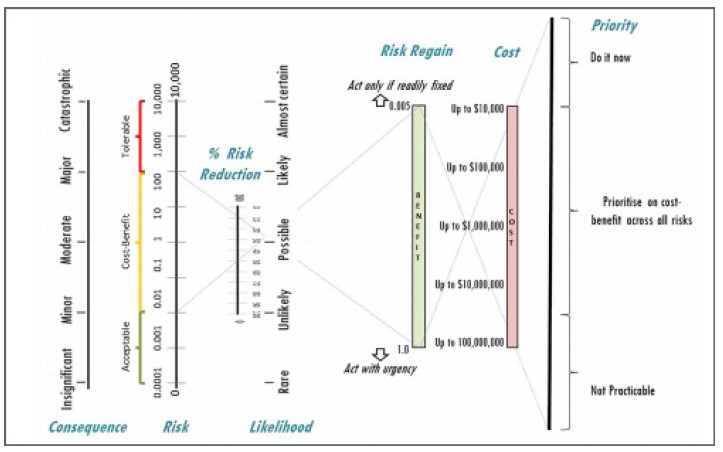
Unlike the matrix approach, the nomogram does not allow accidental formula tampering other than to choose the type of scale for the risk-value tie line. The charts that follow are nomograms in a logarithmic scale and nomograms with a cost-benefit capability. Essentially, nomograms are far more resistant to unintended distortion than the matrix (Australian Government, 2016).
Simple risk nomogram with logarithmic scale
Integrated risk calculation and cost-benefit analysis nomogram
- Harmonised threat/hazard and risk assessment (an application of risk matrices)
(Beauchemin & Dansereau, 2007)
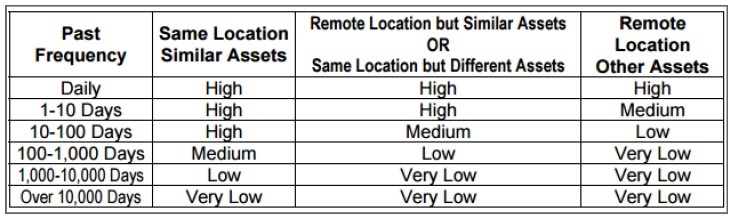
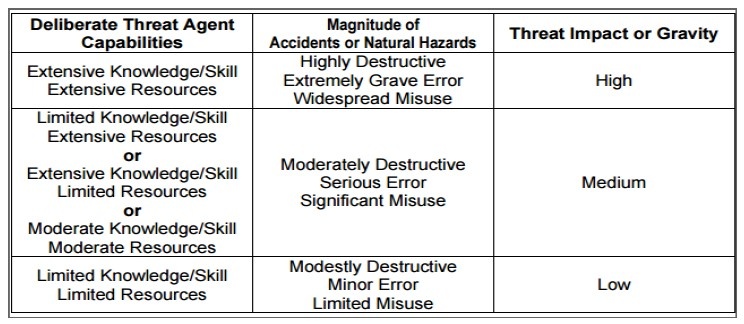
The following are some applications of the harmonised threat and risk assessment methodology.
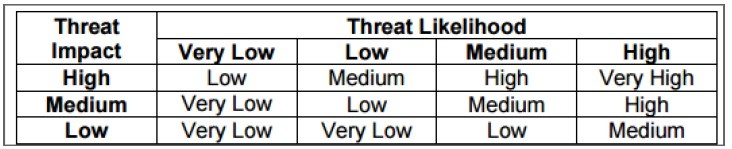
Threat likelihood table
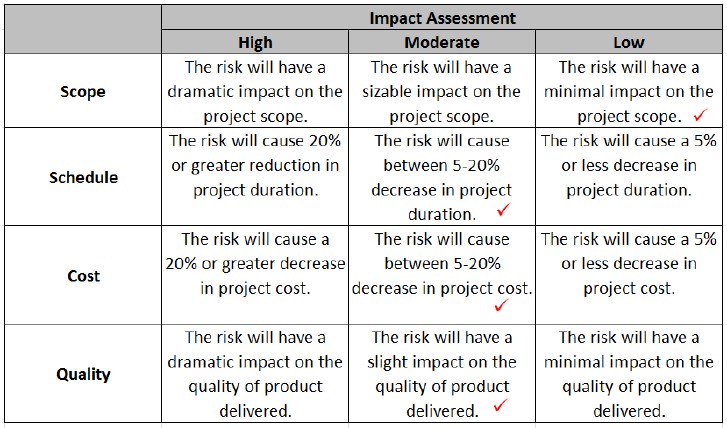
Threat gravity/severity table
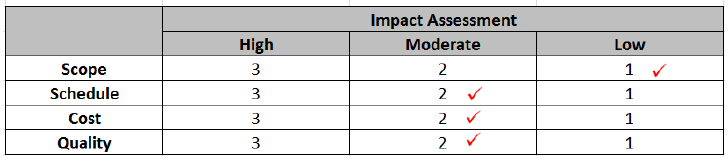
Threat levels table
Impact score: 1 x 2 x 2 x 2 = 8
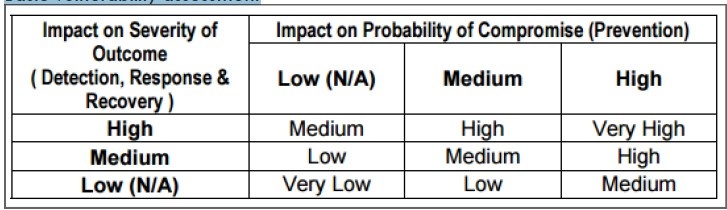
Vulnerability impact on the probability of compromise after risk controls are in place
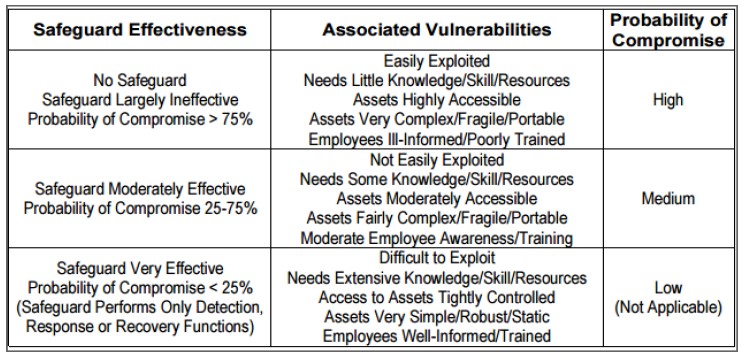
Vulnerability impact on the severity of outcome after control measures are in place
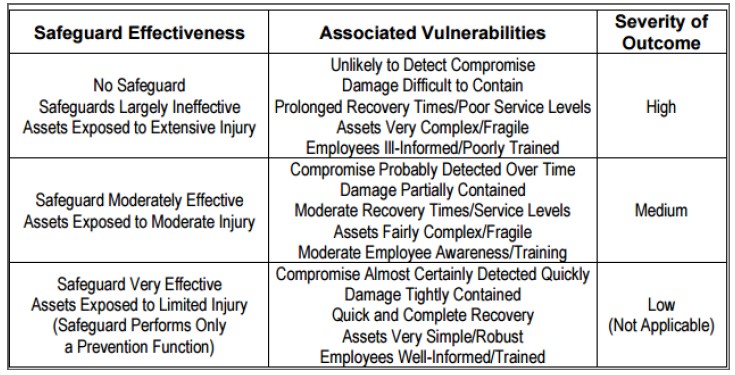
Basic vulnerability assessment
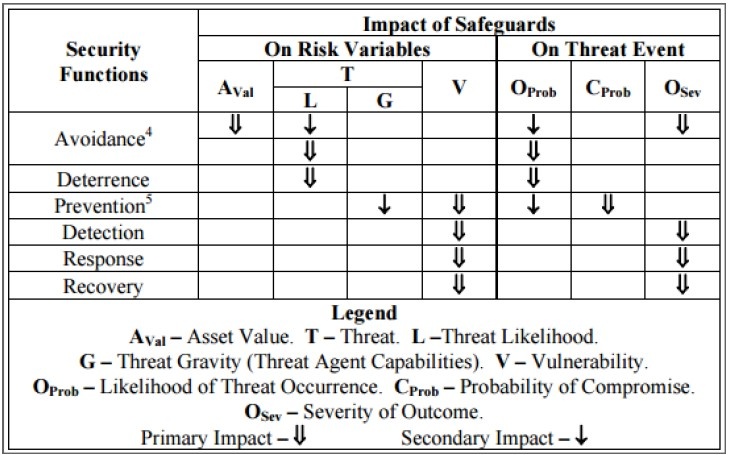
Risk controls’ impact on raw risks
Note: Probability of compromise is for the effectiveness of risk control measures when incident occurs.
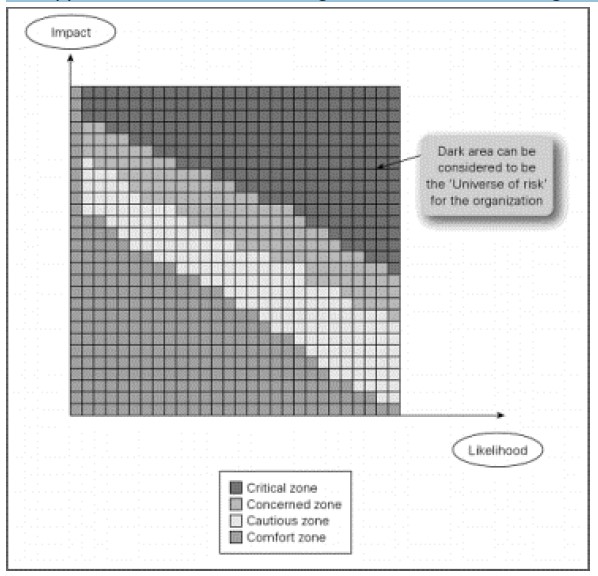
- Risk heat map or Isopleth (an application of the risk matrix concept)
The risks located between red and green areas of the matrix below, especially the major risks are expected to be the key focus for risk assessment and management.
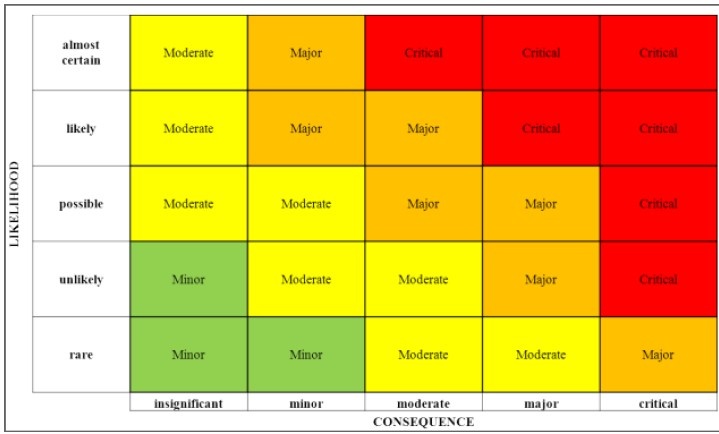
Source: SCRLC, 2011.
- Risk assessment interviews (qualitative scenario analysis): Interviews are very effective at uncovering how the business actually works. Information-seeking tools, such as suggestion boxes and hotlines rely on employees to volunteer information, and anonymity can be a barrier to uncover the root of the problem. Online surveys may not be effective, as not everyone reads every email, and not everyone who reads the email completes the survey. The in-person interview solves these problems. Facilitators have the advantage of being able to read nonverbal cues. Interviewees are more likely to open up in a conversation, especially when they are assured that their comments will remain in anonymity. The chart below highlights the different perspectives and the alignment of management's views on the company's risks, which ensures risk is managed from all angles (Paquin, 2014).


